Income And Substitution Effects
Income And Substitution Effects Assignment Help | Income And Substitution Effects Homework Help
Income and Substitution Effects
Suppose that we have a consumer, with a certain income, who has to choose between different quantities of good 1 and good 2 (which, again, can be thought of as “all other goods”) in such a way that she maximize her utility. If the price of good 1 falls, we get two different effects.
Since the price of good 1 falls, that good becomes cheaper relative the other good. This means that the marginal rate of transformation (MRT; the slope of the budget line) changes. Say that the prices of both goods initially are 1. The relative price is then 1/1 = 1. If the price of good 1 falls to 0.50, the relative price becomes 0.50/1 = 0.50. The consumer can now exchange one unit of good 2 for two units of good 1, and therefore good 1 becomes more attractive to her. As a result, she consumes more of the good. This effect is called the substitution effect.
The purchasing power of the consumer becomes larger because of the drop in the price. She can now buy as much as she did before the price changed, and still have money left. That extra money she can spend on both good 1 and on good 2. This is called the income effect.
In reality, we can only observe the total effect of the price change, i.e. how much more or less the consumer buys of the good. However, we will now see that it is possible to split up the total effect into the substitution- and income effects. Depending on whether good 1 is a normal or an inferior good, we get two different cases.
Normal Good
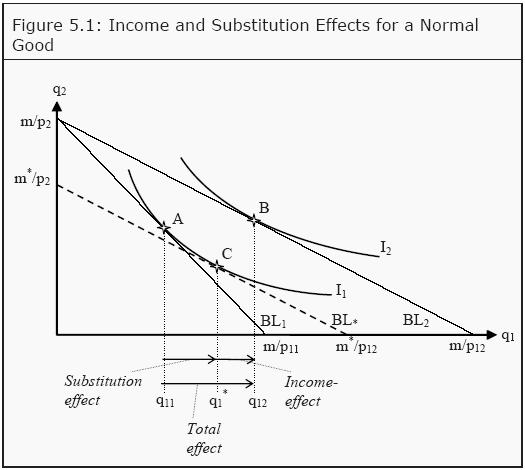
Assume we have the same case as we did earlier: A consumer chooses between good 1 and good 2. Giver her income, m, the prices of the goods, p11 and p2, and her preferences, she chooses that basket of goods that maximizes her utility. In Figure 5.1, this means that she initially chooses point A. If the price of good 1 falls from p11 to p12, the budget line rotates outwards from BL1 to BL2. When the consumer chooses a new basket, she ends up in point B. Her consumption of good 1 has consequently increased from q11 to q12, which is the total effect. We now ask ourselves how much of the change in quantity from q11 to q12 that depends on the income effect (i.e. on the increase in purchasing power) and how much that depends on the substitution effect (i.e. on the change in the slope of the budget line). To answer this question, we first ask another question: If only the relative prices had changed, without the consumer getting any increase in utility, what effect had we then seen. If the relative prices change, the slope of the budget line changes. All budget lines that have the same relative prices as BL2 must also have the same slopes as that budget line. Furthermore, for the consumer to have the same utility as before, she must consume on the same indifference curve as she did before, i.e. on I1. We therefore construct an imaginary budget line, BL*, that has the same slope as BL2 and that, just as BL1, is a tangent to I1. (However, since it has a different slope than BL1, it must touch I1 at different point than that budget line does.) If this had been the real situation, the consumer would have chosen point C. She had then increased her consumption of good 1 from q11 to q1*. At the same time, she would have decreased her consumption of good 2. This substitution from good 1 to good 2 depends on the change in the relative price, but it does not result in any change in the level of utility. This part is the substitution effect. The remaining change, from q1 * to q12, is the part that depends on the increase in the consumer’s purchasing power. As she moves to a higher indifference curve, from I1 to I2, she increases her utility. This part is the income effect.
Inferior Good
The strategy to find the income- and substitution effects for an inferior good is exactly the same as for a normal good, but the result will look slightly different. As previously mentioned, an inferior good is a good one buys less of if one’s income increases. The underlying reason for that is to be found in the preferences. As one becomes wealthier, one can afford to buy something of higher quality instead. This preference will have an effect on the shape of the indifference curves.
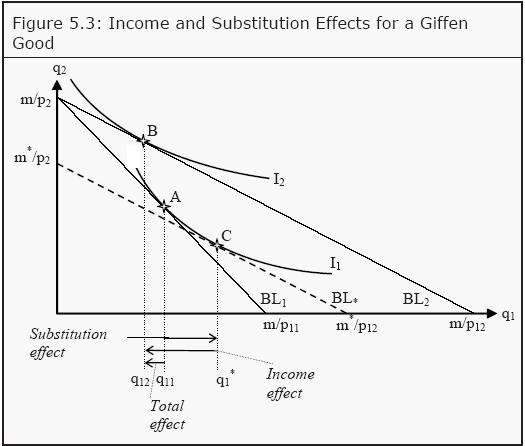
This time, when we split up the total effect into a substitution effect and an income effect, the income effect for the inferior good is negative. The substitution effect is always positive, which means that we get two cases depending on whether the negative income effect is smaller or larger in magnitude than the always-positive substitution effect. Goods that belong to the latter case are called Giffen goods, and these are a very rare kind of goods. Their distinguishing feature is that one buys more of them if the price rises. The demand curve almost always slopes downwards. Giffen goods are consequently an exception from that rule.
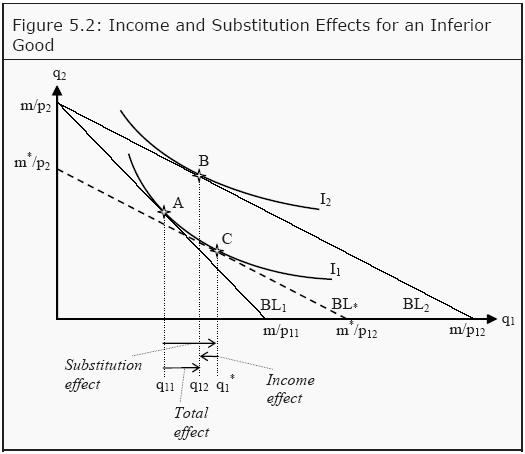
In Figure 5.2, we have almost the same situation as in 5.1. The difference is that the consumer’s indifference curve I2 has been changed so that it touches the budget line BL2 at a point between points A and C. This change makes the income effect negative and the total effect is smaller than before. In Figure 5.3, the indifference curve I2 has been changed again, so that it touches BL2 at a point to the left of point A. The income effect now becomes very negative, so negative that it dominates over the substitution effect. The total effect thereby also becomes negative and we have a Giffen good. Note, however, that the consumer does increase her utility. This can seem strange, as the total effect is that she consumes less of the good analyzed (and we have assumed that more is always better). The drop in the price of the Giffen good means that the consumer can afford to buy more of other goods. Furthermore, these other goods function as substitutes for the Giffen good. Hence, the increase in utility. The increase in consumption of good 2 can be read off as the distance between A and B on the Y-axis.
To get more help in Income and Substitution Effects click the button below to submit your homework assignment