Marginal Efficiency Of Capital Schedule
Marginal Efficiency Of Capital Schedule Assignment Help | Marginal Efficiency Of Capital Schedule Homework Help
Marginal Efficiency of Capital Schedule
The marginal efficiency of capital does not remain constant. It varies inversely with the level of investment. In making investment plans, entrepreneurs assign various rates of return to various levels of investment. As investment increases the marginal efficiency of capital is expected to decrease. The schedule which relates the MEC to alternative levels of investment of an individual firm is referred to as the firm’s marginal efficiency of capital schedule. The sum of all these individual MCE schedules gives us the aggregate MEC schedule.
An Individual Firm’s MEC Schedule
Let us first describe the MEC schedule facing a single firm:| Investment project | Value of project | MEC % |
| A (Machine) B (Truck) C (Building) |
Rs. 10,000 Rs. 5,000 Rs. 15,000 |
10 8 6 |
Depicts a situation faced by the hypothetical firm. The firm’s most profitable opportunity is the purchase of a machine costing Rs. 10,000 with MEC of 10 per cent. Its next profitable possibility is buying a new truck that costs Rs. 5,000 and is expected to yield a return of 8 per cent. The firm could also spend Rs. 15,000 on expanding its building if its expected rate of return is 6 per cent. These prospective projects are ranked in order of decreasing profitability as shown. The solid line thus traced out may be thought of as the firm’s marginal efficiency schedule. If the market rate of
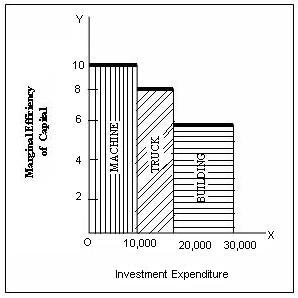
interest is 7 per cent, the firm will find it worthwhile to undertake the first tow investment projects involving Res. 15,000. However, if the market rate of interest is 9 per cent, the firm will find it worthwhile to undertake the first investment project only involving Rs. 10.000. Thus, at a higher rate of interest, the firm’s investment expenditure will be less.
MEC Schedule for the Economy
If the MEC schedules for all the firms in the economy are added together horizontally we get an aggregate MEC schedule. This can be a continuous curve because of the aggregation process.The MEC curve.
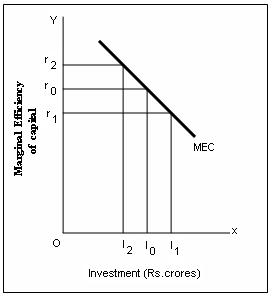
The MEC curve explains the different possible level of investment at different possible marginal efficiency of capital. The downward slope of the MEC curve shown the inverse relationship between the level of investment and the marginal efficiency of capital. As the level of investment entincreasses from I0 to I1, the marginal efficiency of capital decreases from r0 to r1 . As the level of investment decreases form I0 to I2 the marginal efficiency of capital increases from r0 to r2
The inverse relationship between investment and the marginal efficiency of capital can be accounted for by the following two reasons:
Firs, with an increase in investment in more and more machines, the prospective return from the additional unit of investment starts diminishing on account of operations of the law of diminishing marginal returns.
Secondly, increase in investment is bound to create different effect. Increased investment, on the one hand, leads to an increase in the price of goods. Thus, it creates two important effects, viz., (a) an increase in the cost, and (b) an increase in the price of goods product. Owing to an increase in the cost of production of capital and decease in the returns, the marginal efficiency of capital falls as investment increase
Shift in MEC : Role of Expectations in Private Investment
The marginal efficiency of capital is based not expectation of businessmen which change according to fluctuations in business sentiment. A highly optimistic attitude of businessmen regarding the expected returns of capital investment would cause the MEC curve to shift upwards. Such a shift is depicted by the MEC1curve in the prevalence of business optimism, the expected rate of returns for a given level of investment (e.g., I1) is hither for MEC1 than for MEC0 (r2 > r1) ; or for a given rate of return (e.g., r1) ,t he level of investment is greater for MEC1 than for MEC0 (at r1, the level of investment is I for MEC0 and I0 for MEC1). Concersely, when business pesimism previls curve will shift downward to the left.For more help in Marginal Efficiency of Capital Schedule click the button below to submit your homework assignment