Market Demand
Market Demand Assignment Help | Market Demand Homework Help
Market Demand
The market’s demand consists of all individuals’ demand. To find the market demand curve, we have to sum up the demand of all individuals for each price. Suppose, for instance, that we have found demand curves for three different individuals, and that these three individuals together are the whole market. In Figure 4.3, their demand curves (for simplicity, they are all straight lines) are labeled D1, D2, and D3.
If the price of the good is 4, all individuals demand a quantity of 0, but at a price of 3, the first individual demands 2 units. Since the others do not demand anything, the market’s total demand is those 2 units. For prices between 3 and 4, the market’s demand coincides with D1, i.e. the demand curve of the first individual. (A straight line from point (0,4) to point (2,3)) When the price is 2, the first individual demands 4 units and the second demands 5 units. The market’s total demand is then 9 units. For prices between 2 and 3, total demand is D1 + D2. It will then be a straight line beginning in point (2,3) and ending in point (9,2).
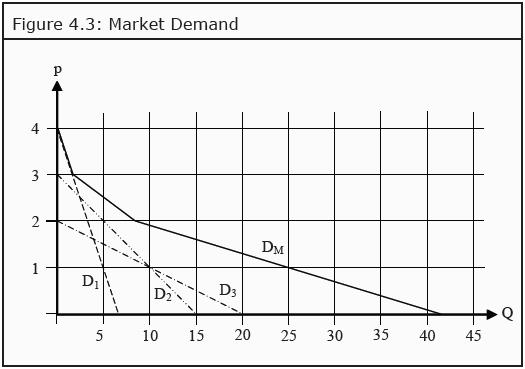
When the price is close to 0, all individuals demand it: The first demands 7 units, the second demands 15 and the third demands 20. Total demand is then 42 units. For prices between 0 and 2, total market demand is D1 + D2 + D3. It will then be a straight line starting in point (9,2) and ending in point (42,0).
Note that we should not really allow a price of 0. Demand would then be infinite as more of the good is, by assumption, always better. The market demand curve, DM, will consequently be the sum of the individual demand curves. If the individual demand curves are straight lines, the market demand curve will become a succession of straight lines, where a break signals that a new consumer starts demanding the good at that price.
To get more help in Market Demand click the button below to submit your homework assignment