Oligopoly
Oligopoly Assignment Help | Oligopoly Homework Help
Oligopoly
An oligopoly is a market in which there are only a few sellers. Most of the models in the literature only cover cases in which there are two sellers. Such markets are also called duopolies. As you will see, the analysis of oligopolies is quite complicated. Furthermore, there are several different models that all yield different results. This can be quite confusing. Take some time to see what the differences are in the assumptions and why they give different results. Which model to use, depends on what the situation is in a particular case. Different structures can have dramatically different effects on the market.
Kinked Demand Curve
Assume there are only a few firms in a market and that they all produce exactly the same good. Furthermore, assume that there is already a price has already been set. (For now, we will ignore the question from where this price has come.) If we were one of the firms, how would we reason regarding our own price setting? What would happen if we would raise the price? Most of the customers would then buy from our competitors instead, to get the good at a lower price. The competitors would probably not lower their prices, as they would gain a larger market share instead. Consequently, we would sell much fewer goods. Conversely, what would happen if we lowered our price? If the competitors did not also lower their prices, we would gain a large part of their market shares. Since that would mean that they would reduce their profits, they would probably lower their prices as well.
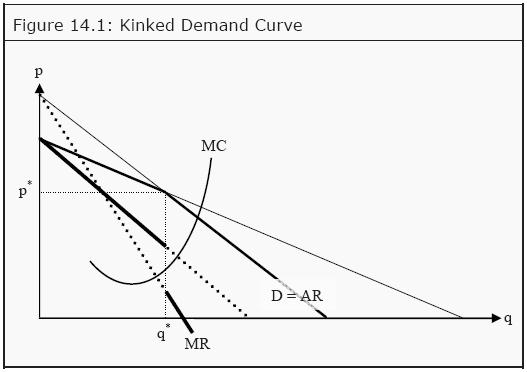
The slope of the demand curve that our firm faces is therefore different depending on whether we increase or decrease our price. This results in a socalled kinked demand curve, where the bend occurs at the existing price, p*, and the corresponding quantity, q* (see Figure 14.1). The bend in the demand curve makes the construction of the MR curve more complicated. To find the MR curve, we extend the two parts of the demandcurve, D, until they reach the two axes. (The extensions are the thin lines in the figure.) As the (real and imagined) demand curves are downward sloping, their corresponding MR curves will also be downward sloping, intercept the Y-axis at the same points, but have a slope which is twice as large.Since D now has two parts, we do this for each part separately. Since the demand curve is bent at the quantity q*, the MR curve will also change at that quantity. To the left of q*, we use the MR curve that is derived from that part of the demand curve that is valid to the left of that quantity. To the right of q*, we instead use that MR curve that is derived from the part of the demand curve that is valid to the right of it. This causes the final MR curve to make a jump at q*. In Figure 14.1, the final MR curve is indicated with thick full lines. The parts that are not used, since they correspond to the extensions of the demand curve, are indicated with thick dotted lines. Just as before, a criterion for profit maximization is that the firm sets the quantity where MR = MC. In the models we have used this far, that criterion singled out exactly one point. However, since the MR curve now makes a jump at the quantity q*, the MC curve can intersect the MR curve in that interval. At the prevailing price, it must do so by construction. This means that if the marginal cost, MC, only changes a little bit, for instance because a small tax is introduced on each unit sold, the firm might not change its produced quantity, and consequently not the price. As long as the MC curve still intersects the MR curve at the jump, the firm will produce the same quantity, q*. However, the increase in MC will lead to a reduction in profit for the firm. This is one way that the real-world phenomenon of sticky prices can be explained. According to the previous market-models (perfect competition and monopoly), prices should change immediately if quantities change. However, often we see that prices change more seldom; they seem to be stuck at a certain level for a while. If prices and quantities are set according to the kinked demand curve-model, however, this is exactly what we should expect.
How does the Price in the Kinked Demand Curve Arise?
In the analysis in last section, we ignored the question of how the price had arisen. One idea is that the sellers can have agreed on the price. If sellers can cooperate on the price setting, they will optimally agree to set a price that corresponds to the quantity a monopoly would have chosen, since the monopoly profit is the largest one can possible make in a market. Then they could split the monopoly profit between themselves. However, that would amount to setting up a cartel, and that is against the law. Many people argue, however, that firms can have tacit agreements. There is no real cartel, but there is a sort of silent agreement that each seller should set a high price. A frequently used example is the way gasoline distributors set their prices. Often, one firm announces that they will increase their price. Then the other firms follow immediately. Note however, that this type of behavior can also be against the law.
For more help in Oligopoly and Kinked Demand Curve click the button below to submit your homework assignment