Moodys Diagram
Moodys Diagram Assignment Help | Moodys Diagram Homework Help
Moody’s Diagram
• L.F. Moody’s diagram is a graph plotted to find Darcy-Weisbach friction factor for commercial pipe.
• The diagram is plotted in the form of frictional factor verses Reynold’s number Re curves for various value of relative roughness (R/k.)
• It is similar to Nikuradse’s plot expect for the transition regions.
• Moody’s has plotted curve for equation.
1 / √f - 2 log10 (R / k) = 1.74 - 2 log10 ( 1 + 18.7 R/k / Re√f )
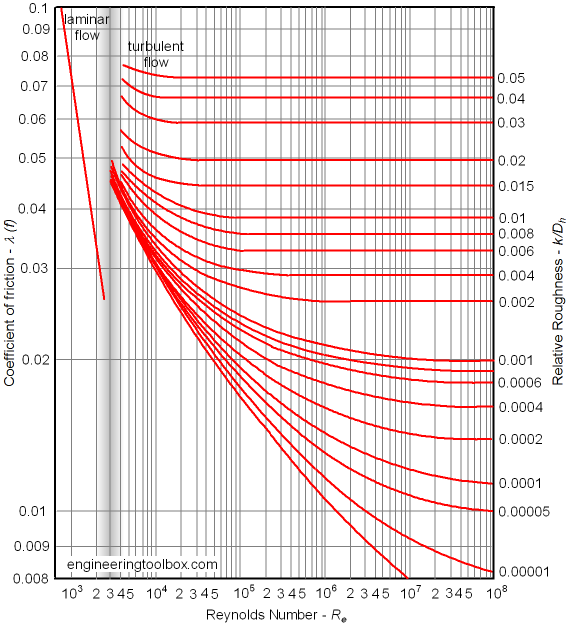
• Which helps to determine friction factor the curve if the numerical values of R/k and Re of flow is known.
• The value of equivalent sand grain roughness k is depends on the condition of material. As the pipe become older the roughness increase due to corrosion.
For more help in Moody’s Diagram click the button below to submit your homework assignment
• The diagram is plotted in the form of frictional factor verses Reynold’s number Re curves for various value of relative roughness (R/k.)
• It is similar to Nikuradse’s plot expect for the transition regions.
• Moody’s has plotted curve for equation.
1 / √f - 2 log10 (R / k) = 1.74 - 2 log10 ( 1 + 18.7 R/k / Re√f )
• Which helps to determine friction factor the curve if the numerical values of R/k and Re of flow is known.
• The value of equivalent sand grain roughness k is depends on the condition of material. As the pipe become older the roughness increase due to corrosion.
For more help in Moody’s Diagram click the button below to submit your homework assignment