Lorenz Curve
Lorenz Curve Assignment Help | Lorenz Curve Homework Help
Lorenz Curve
The Lorenz Curve, devised by Max O. Lorenz, a famous economic statistician, is a graphic method of studying dispersion. This curve was used by him for the first time to measure the distribution of wealth and income. Now the curve is also used to study the distribution of proof its, wages, turnover, etc. However, still the most common use of this curve is in the study of the degree of inequality in the distribution of income and wealth between countries or between different periods of time. It is a cumulative percentage curve in which the percentage of items is combined with the percentage of other things as wealth, profits, turnover, etc.While drawing the Lorenz curve the following procedure is adopted:
(i) The size of items (variable values) and frequencies are both cumulated. Taking grand total for each as 100, percentages are obtained for these various cumulative values.
(ii) On the X-axis start from 0 to 100 and take the per cent of cumulative frequencies.
(iii) On the Y-axis start from 0 to 100 and take the per cent of the cumulated values of the variable.
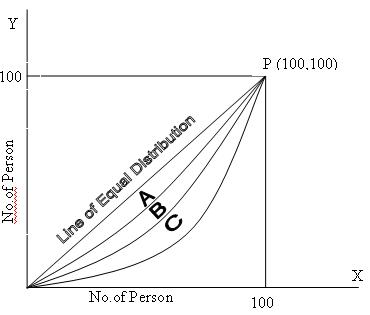
(iv) Draw a diagonal line joining O (0,0) with the point P (100,100) as shown in the diagram below. The line OP will make an angle of 45degree with the X-axis and is called the line of equal distribution. Any point on this diagonal shown the same percent on X as on Y.
(v) Plot the percentage of the cumulated values of the variable (Y) against the percentages of the corresponding cumulated frequencies (X) for the given distribution and join these points with a smooth freehand curve. For any given distribution this curve will never cross the line of equal distribution OP. It will always lie below OP unless the distribution is uniform is which case it will coincide with OP. The greater the variability the greater is the distance of the curve from OP.
In the diagram OP is the line of equal distribution. The points lying on the curve OAP indicates a less degree of variability as compared to the points lying on the curve OBP. When the points lie on the curve OCP, variability is still greater. Thus a measure of variability of the distribution is provided by the distance of the curve of the cumulated percentages of the given distributions from the line of equal distribution.
For more help in Lorenz Curve click the button below to submit your homework assignment